Charts and indicators
What are indicators, and why do traders need it?
I want to join
charts tags image
charts image
  • Find. Indicate. Create. Earn. 
  • Find. Indicate. Create. Earn. 
  • Find. Indicate. Create. Earn. 
  • Find. Indicate. Create. Earn. 
  • Find. Indicate. Create. Earn. 
  • Find. Indicate. Create. Earn. 
  • Find. Indicate. Create. Earn. 
  • Find. Indicate. Create. Earn. 
  • Find. Indicate. Create. Earn. 
  • Find. Indicate. Create. Earn. 
  • Find. Indicate. Create. Earn. 
  • Find. Indicate. Create. Earn. 
  • Find. Indicate. Create. Earn. 
Indicators are significant supportive tools of technical analysis. They serve to determine the current market condition and its possible moves in the future. Stock traders used indicators long before the era of computers by building charts manually
image
Today, modern indicators can be characterized

as software solutions that allow you to spot various patterns and receive signals about the best time to enter/exit a trade under certain market conditions.

Indicators automate the collection of information about assets, providing traders with data on changes in quotes, trading volumes, interest from other market participants, and much more. The indicator analysis is also referred to as algorithmic.
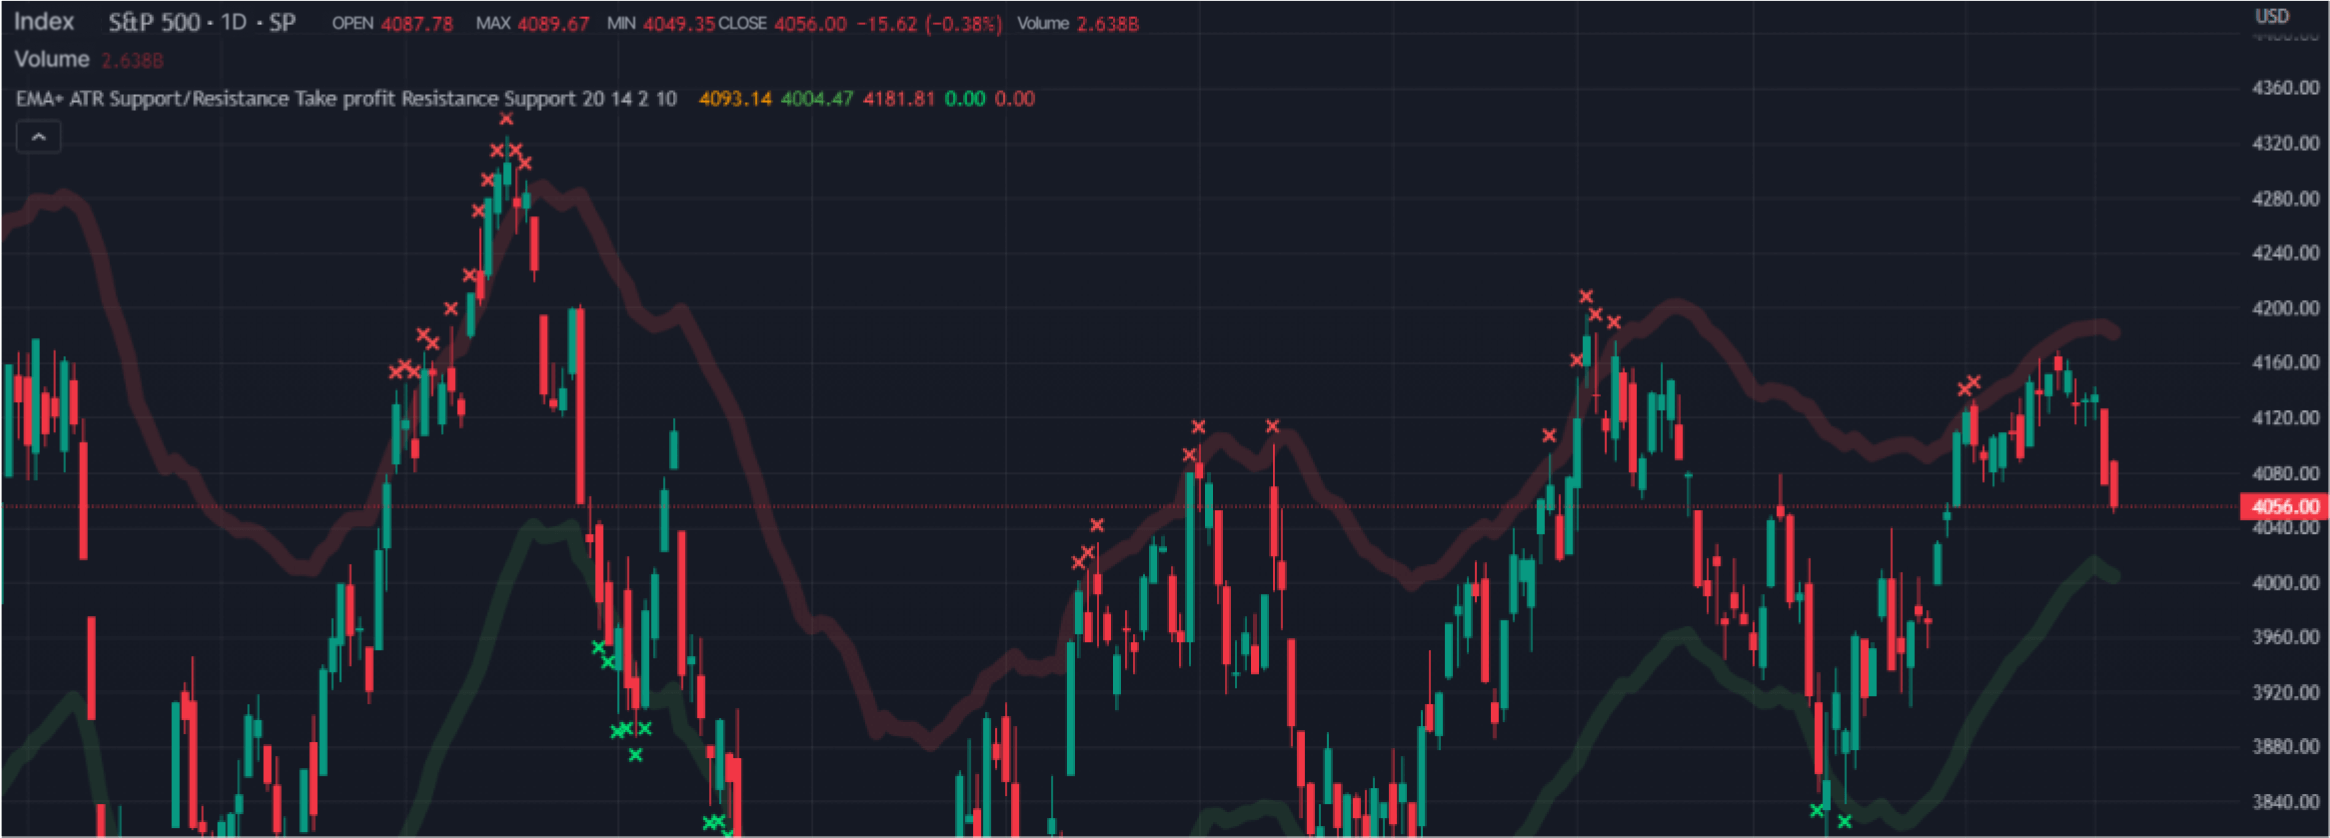
The results of the indicators' work are displayed via charts and oscillators that can be split into measures of trend, volume, overbought/oversold, and momentum of an asset
charts image
Indicators on the Collective Forecast
Our platform features dozens of popular public indicators, as well as proprietary tools developed by the professional Collective Forecast team
All registered users
automatically receive free access to a broad range of popular and rare indicators, including RSI, MFI, KDJ, MACD, and many others. You can use one or several indicators at once for market analysis, as well as calculate the most favorable moments for opening and closing positions
Purchase the access
Finally, those of you who follow the forecasts of successful traders and are willing to use their authoring tools will soon be able to easily purchase the access to indicators by any selected investor
Users with a paid subscription
get access to unique private indicators that can't be found elsewhere except for Collective Forecast. To benefit from private indicators, the client will have to purchase one of various subscriptions of different levels available on our platform. Thus, the higher the subscription level, the more private indicators the user gets
Purchasing indicators
By purchasing our copyrighted or custom indicators you get access to even more accurate data analysis on the assets' price changes, traded volumes, and trend vectors under unique algorithms and presets
Read further to learn about eight one-and-only indicators developed by Cofo Lab. It's worth noting that this list will be regularly updated, as our team never stops working on new instruments
Our indicators preview
Charts image
Market Flow
The Market Flow indicator is a powerful analytical tool that provides traders with valuable information about the current market movement, as well as possible position entry and exit points
The indicator helps spot potential moments when the trend may change or develop, providing data on overbought and oversold markets. This can determine a more advantageous time to buy or sell an asset
Impulse
The Impulse indicator is a reliable analytical tool designed to spot potential strong turning points
With its help, traders can identify critical overbought and oversold points. Impulse helps spot powerful shifts in price movements. Thus, if there is a strong market move in a certain direction, the Impulse indicator helps to find the moment when such a trend is on the verge of a reversal or rebound
MA
The MA, or moving average indicator, is an analytical tool to simplify market analysis. MA allows you to use different moving averages over multiple periods, making it mucheasier to identify short-term and long-term trends
The MA displays moving average indicators on a chart and generates signals related to the difference between the moving averages, which help detect a potential price impulse and increased volatility points. MA flatterns the asset’s price fluctuations, which allows traders to easily spot the price movement direction of the selected currency pair
MFI Premium
The MFI Premium indicator is based on the classic instrument by Bill Williams and is an intuitive analytical tool for deeper market analysis
Thus, not only does the indicator determine the market behavior after a sharp or minor change in the asset trading volume, but it also reveals the overbought/oversold zone. MFI Premium is expressed as a histogram, which makes it easier to find divergences between price dynamics and the indicator
Random
The Random indicator is a unique analytical tool for assessment of the market dynamics based on fundamental indicators
It highlights the key overbought and oversold points, providing visual signals via moments for buying and selling. Additionally, color areas, which are significant elements of the indicator, help to spot the points, associated with long-term or short-term trends at ease
RSI
The RSI on our platform is a modified version of the classical indicator
Like its predecessor, our RSI analyzes the strength of price momentum and provides data on the level of the assets' overbought or oversold. Moreover, it also signals possible pivot points, allowing you to detect hidden signals on the chart that may indicate possible trend reversals. This functionality allows traders to pay more attention to potential market changes
Trendline
The Trendline indicator is a modern analytical tool that helps traders monitor the price trend directly on the chart
Trendline is based on Heiken Ashi and volumes. Using built-in signals, the indicator also provides an opportunity for tracking the positions' entry and exit points. Another indicator's crucial feature is the trailing stop based on ATR (Average True Range), which helps you find a safe spot to place your stop loss
Big Splash Signal (BSS)
The Big Splash Signal (BSS) indicator is a helpful analytical tool for tracking detailed market dynamics on a chart
Based on algorithmic analysis, BSS includes unique techniques for identifying key market reversals, calculated given the differences between minimum and maximum prices. Not only does this tool track price changes, but it also conducts a resonant analysis of market dynamics and gives away three-level signals, reflecting major players' areas of interest
Charts
Charts help traders monitor changes in quote prices, indicate whether assets are being bought or sold, and provide an evident picture of market behavior. Based on the charts, users decide on investments, build trading strategies, and conduct market analysis.

Collective Forecast provides traders with a wide range of charting capabilities, thriving on data from over 50 indicators and other analytical instruments. An extensive set of drawing tools allows users to find their way to track and visualize the assets' price movements right in the trading interface.

Moreover, you can observe other participants' charts and compare the forecasts of successful traders for the selected cryptocurrencies and other financial assets.

With us, you will find publicly available charting tools and advanced functionality with professional instruments, each designed to display the actual picture of market fluctuations and analyze price patterns in real-time.

charts img 2
trading view chart image
To visualize data and enhance stock valuation, we utilize a solution from TradingView. This platform not only empowers you to create charts and conduct technical price analysis for various assets, including currency pairs, stock indices, and individual stocks but also equips you with valuable tools like an Economic Calendar to monitor significant market-affecting events. Additionally, TradingView offers a Screener, which is instrumental in discovering assets aligned with your preferred trading parameters. If you're interested in learning how to use a stock screener effectively, TradingView provides the resources and community support you need. On TradingView, you can connect with other traders, exchange ideas, and share analytics, fostering a dynamic environment for enhancing your stock valuation skills and market knowledge.
ava img ava img ava img ava img ava img

Our platform's easy-to-use charting tools your trading strategy!

Try now!